


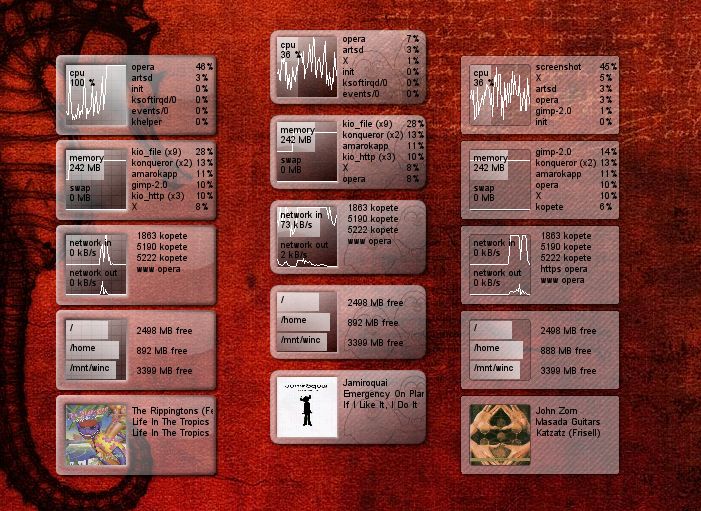
* cpu usage
* mem/swap usage
* network in /out
* disk usage
* optional: amarok cover/title
But TopMon also parses the output of the "top" command so you can see the cpu and memory usage of the most using processes (see screenshots). It also lists the current processes talking to the network.
In order not to spill to much of your precious cpu cycles, the "querying" of top is only done every 15 seconds or another interval if you dare changing the python script (look for tableRefreshDelay).
It is also possible to force a refresh by clicking (or double clicking if you didn't lock position) the graph area. This works also for forcing the amarok cover to update.
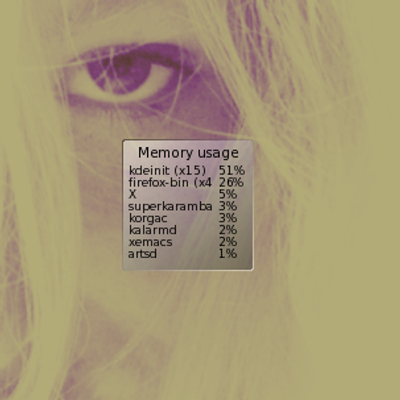
Due to double counting of shared memory between several processes the sum of the percentages of memory usage can be bigger than 100%. It's not my fault, it's how top works

You probably need to edit the .theme-file for making it fit your partition layout. There's no other way, sorry.


Ratings & Comments
10 Comments
I've been using your theme for a while now - it has everything I want all in one spot. I do have a question and a comment though. Question: Is it possible to have the CPU sensors ignore the NICE processes? I am running a process at nice 19, which is to say, it barely ever runs, except when I have free CPU power, and that means that my total CPU usage is always 100%. It would be handy to ignore the nice processes and display only the real loads. Comment: Take a look at Borialis theme. It has a nice feature where each group is seperate and you can choose which group to enable and which to not display. I don't have a need for the Amarok group, so it is just taking up space on my Desktop. Likewise, the harddrive usage group is not useful that often :-) Great theme outside of that. Keep up the good work
You may be interested that I updated my way outdated Karamtop Superkaramba theme to directly read /proc. With some heavy modification you may find it useful. http://www.kde-look.org/content/show.php?content=13140
Very nice theme. I'm getting > 100% memory for a singe entry (kdeinit). Is that just a problem with top, or can it be fixed? Thanks.
Its a problem with top: for each process I get total memory footprint (including shared memory), so by summing that you count the shared memory double/triple/... I don't know how to fix it.
one thing though, the size is too small could u consider of making it a little bigger, other then that great one i love the information from top command, 10x alot.
Thanks. But I don't understand totaly what you mean. If you only want the fonts bigger, you can do it yourself: look for "fontsize" in of topmon.theme and topmon.py (for bigger fontsizes you should also lower numberOfLines in topmon.py) If you want the whole widget bigger, I'm afraid I have to disappoint you: I don't think I will find time to do that. I've spent already more time on topmon than my girlfriend could bear ;). Sorry
Nice work, but I found that running topmon increased my X cpu usage with 50% I guess that karamba is not really suited for apps refreshing every second.
That's weird. Topmon is refresh-wise just like other monitoring karamba's. The only difference is that every 10 seconds it also runs and parses "top". That shouldn't kick your cpu usage to 50%, I presume. How long did you let it run (maybe it was just a startup thing)? What happens if you run top on the commandline in non interactive mode like in my karamba theme: "top -b -n1"?
HI!! Great Karamba theme, more than eyecandy is hell of util. Small and very informative, something like this was needed. Do you mind if i make new backgrounds and send it to you in order to upload them?? cheers!!!
thanks, no problem at all for sending me another "skin". (stefaan.lippens (at) gmail com) I'm also working on a more simple/flat look.