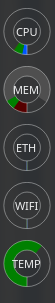
Description: The sysmon plasmoid is based on KDE standard system load plasmoids which are constrained to some chosen metrics like CPU load. In contrast, the sysmon can show any metric provided by the System Monitor data source engine.
Installation is pretty simple and straight forward:
Nice widget!It will be perfect if I can add some executable data source,like nvidia-smi.I have tried modify the codes,but it's not easy for me.So,add this function PLZ!!!
Absolutely love this! I really hope it's being further developed. A few suggestions: values in circular mode are displayed with "5,..." when space is too narrow, values without fractional part would look much better. CPU usage less than 1% is displayed in per mill which looks odd. Plotter mode ignores maximum value which actually makes it useless. Showing the exceed of maximum value in a different colour would make it even more useful.
Hi Burlog
Thanks for your reply. I get the following:
[munawar@dell ~]$ cd ~/.local/share/plasma/plasmoids/com.github.burlog.plasmoid-sysmon
[munawar@dell com.github.burlog.plasmoid-sysmon]$ plasmoidviewer --applet .
bash: plasmoidviewer: command not found
Hi Burlog
After above I tried using plasmoidviewer differently and got the following:
[munawar@dell com.github.burlog.plasmoid-sysmon]$ plasmoidviewer --applet /.local/share/plasma/plasmoids/com.github.burlog.plasmoid-sysmon
QML debugging is enabled. Only use this in a safe environment.
qml: View QML loaded
Toolbox not loading, toolbox package is either invalid or disabled.
qml: New Containment: ContainmentInterface(0x55f70c014490)
Constructing a KPluginInfo object from old style JSON. Please use kcoreaddons_desktop_to_json() for "/home/munawar/.local/share/plasma/plasmoids/com.github.burlog.plasmoid-sysmon" instead of kservice_desktop_to_json() in your CMake code.
Hi,
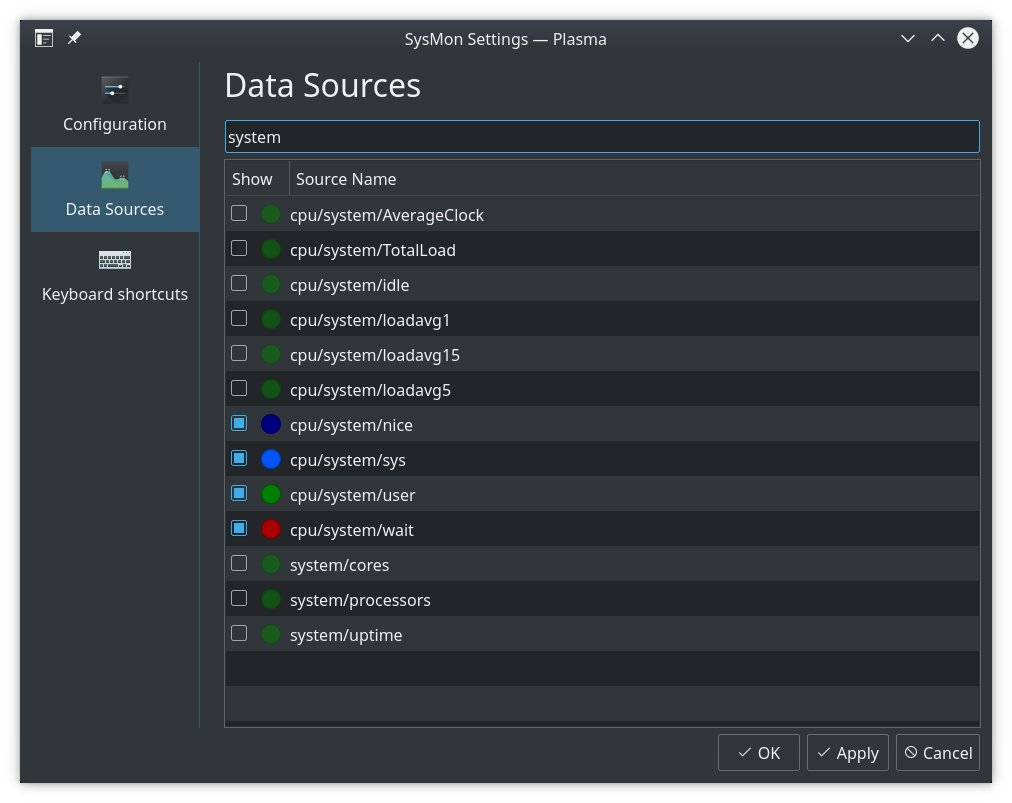
it seems like that systemmonitor doesn't provide any "sources" or they aren't added to table in Data Sources table.
Do you see any rows in this table and just the sources name column is empty or even rows is missing?
Have you tried to open the configuration dialog and click to Data Sources tab in plasmoidviewer?
Is there any "error" message in plasmoidviewer console output if you try it?
Is ksysguardd process running?
$ ps ax | grep ksysguardd
You can also try to see if systemmonitor is in output of this command
$ plasmaengineexplorer --list systemmonitor
and if yes do you see any DataSources:
$ plasmaengineexplorer --engine systemmonitor
You can edit ~/.local/share/plasma/plasmoids/com.github.burlog.plasmoid-sysmon/contents/ui/DataSourcesConfig.qml file and add new lines between 73-74 and 74-75 lines how the example shows:
for (var i in systemmonitor.sources) {
print("before filter", i)
if (systemmonitor.sources[i].match(/[^\x{0000}-\x{007F}]/)) continue
print("after filter", i)
After file saving the plasma must be restarted. You can logout and login or you can run
$ killall plasmashell && plasmashell
Thanks for "debuging" :)


Ratings & Comments
17 Comments
Nice widget!It will be perfect if I can add some executable data source,like nvidia-smi.I have tried modify the codes,but it's not easy for me.So,add this function PLZ!!!
Sorry for the Comment,how to delete it?
System monitor DATA source in sysMon settings seems to be buggy! the Source Name fields are blank.
9 9 excellent
9 +
Awesome widget! How do I get multiple circular displays into a single plasmoid?
9 + However, it is missing the nvidia sensors (nvidia-smi)
Can we get rid of the outline for circular monitor?
9 +
9 +
Absolutely love this! I really hope it's being further developed. A few suggestions: values in circular mode are displayed with "5,..." when space is too narrow, values without fractional part would look much better. CPU usage less than 1% is displayed in per mill which looks odd. Plotter mode ignores maximum value which actually makes it useless. Showing the exceed of maximum value in a different colour would make it even more useful.
9 awesome flexibility, but wish for more features
Installed with ease on my KDE Manjaro 17. However the 'Source Name' column in Data Sources is blank. Any tips?
Hello, can you send me output of this commands: $ cd ~/.local/share/plasma/plasmoids/com.github.burlog.plasmoid-sysmon $ plasmoidviewer --applet .
Hi Burlog Thanks for your reply. I get the following: [munawar@dell ~]$ cd ~/.local/share/plasma/plasmoids/com.github.burlog.plasmoid-sysmon [munawar@dell com.github.burlog.plasmoid-sysmon]$ plasmoidviewer --applet . bash: plasmoidviewer: command not found
Hi Burlog After above I tried using plasmoidviewer differently and got the following: [munawar@dell com.github.burlog.plasmoid-sysmon]$ plasmoidviewer --applet /.local/share/plasma/plasmoids/com.github.burlog.plasmoid-sysmon QML debugging is enabled. Only use this in a safe environment. qml: View QML loaded Toolbox not loading, toolbox package is either invalid or disabled. qml: New Containment: ContainmentInterface(0x55f70c014490) Constructing a KPluginInfo object from old style JSON. Please use kcoreaddons_desktop_to_json() for "/home/munawar/.local/share/plasma/plasmoids/com.github.burlog.plasmoid-sysmon" instead of kservice_desktop_to_json() in your CMake code.
Hi, it seems like that systemmonitor doesn't provide any "sources" or they aren't added to table in Data Sources table. Do you see any rows in this table and just the sources name column is empty or even rows is missing? Have you tried to open the configuration dialog and click to Data Sources tab in plasmoidviewer? Is there any "error" message in plasmoidviewer console output if you try it? Is ksysguardd process running? $ ps ax | grep ksysguardd You can also try to see if systemmonitor is in output of this command $ plasmaengineexplorer --list systemmonitor and if yes do you see any DataSources: $ plasmaengineexplorer --engine systemmonitor You can edit ~/.local/share/plasma/plasmoids/com.github.burlog.plasmoid-sysmon/contents/ui/DataSourcesConfig.qml file and add new lines between 73-74 and 74-75 lines how the example shows: for (var i in systemmonitor.sources) { print("before filter", i) if (systemmonitor.sources[i].match(/[^\x{0000}-\x{007F}]/)) continue print("after filter", i) After file saving the plasma must be restarted. You can logout and login or you can run $ killall plasmashell && plasmashell Thanks for "debuging" :)